
Transit DCA
Overview
Transit-DCA is a model developped to calculate key indicators for transport networks, sch as network coverage, operating costs, necessary fleet size per line, vehicle.kilometers, using easily accessible input data. It provides an initial overview of a network's performances and offers ways to visualize results on a map, making quantitative data easy to comprehend and interpret.
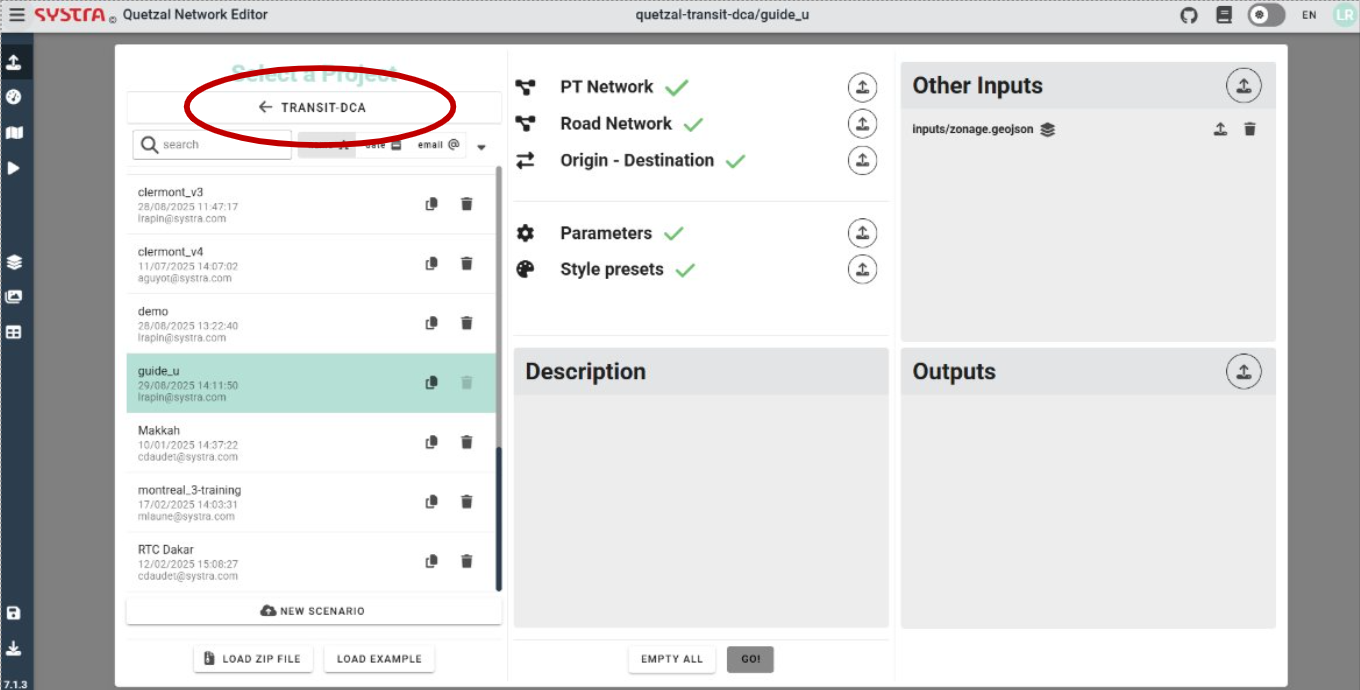
To create or open a TRANSIT-DCA scenario, ensure that the TRANSIT-DCA model is selected in the Input tab. To create a new scenario, press NEW SCENARIO and name your scenario. To open an existing scenario, scroll through the list of existing scenario and click on the scenario you want to open.
Scenario inputs
To initialize your project, you need to provide inputs in the Inputs tab. The following are the inputs required for the model to run its calculations and analyses, resulting in the outputs you receive. The level of detail of the outputs depend on the different inputs you provide:
PT network (mandatory): Public transport network, links and nodes. There are different ways to generate it:
- By drawing it directly in the platform (under the Maps tab)
- By downloading it from a GTFS from the open-source mobilitydata database directly in the app using the GTFS importer micro-service.
- By uploading it from your computer (pt links and nodes are required to be stored in two seperate geojson files)
See section 04_pt_network for more detail on how to upload and edit PT networks, and on different properties to fill when defining the lines to compute indicators.
Paramaters (mandatory): Json file providing simulation parameters. You can modify the parameters in the Simulation Tab.
Road network (optional): Road network, links and nodes. Providing a road network is optional; however, including it can significantly enhance your analysis, especially if your model incorporates public transport modes that utilize the road network (bus, express bus) by allowing to create bus lines that follow actual roads and adapt their speed. Road network can be:
- Downloaded directly from OpenStreetMap database through the OSM import microservice for a chosen area.
- Uploaded directly from your computer
In this documentation, please refer to this section for more detail on how to upload road networks and this section for more detail on how to edit road networks.
OD matrix (optional): For additional results regarding modal share estimations and flow estimates, you can provide an OD matrix in geojson format. The requirements in terms of format are as follows:
- "geometry": LineStrings origin (first point) to destination (last point)
- "origin": origin point id (will be atributed to the position of the first point of the linestring geometry)
- "destination": destination point id (will be attributed to the position of the first point of the linestring geometry)
- "volume": volume field
Load the file in the OD Matrix section of the inputs tab. Alternatively, you can draw the OD-matrix in the OD subsection under the Maps tab.
Zoning file (optional): file containing socio-economical data and used to compute network, line and station coverage indicators. To compute coverage, you must provide a zoning file named zonage.geojson. Here is the main information it must include:
- "geometry": column giving zone shapes (crs 4326)
- "population_density", "jobs_density"... : Densities for each item whose catchment should be computed (item1, item2...) in the format item1_density, item2_density... expressed in item/km². Relevant items include population, jobs, medical facilities...
For population and jobs, a zoning file can be easily generated from a SYSMAP export, using the script hosted here: Snippet
Once your zoning file is ready, load it into the additional inputs section under the inputs tab.
Style requirements (optional): Defines the symbology of the output GIS layers. You can download style requirements from a TRANSIT-DCA project and reuse them in your own project.
Public Transport Network Setup
Public transport network lines can:
- be drawn directly in the app under the Map tab (see section Create a new line in the Public Transport Editor)
- imported using GTFS format via the GTFS importer micro-service (see section Import lines through the GTFS importer micro-service)
- simply imported via a ZIP file of a pre-existing road network under the Import tab
Create a new line in the Public Transport Editor
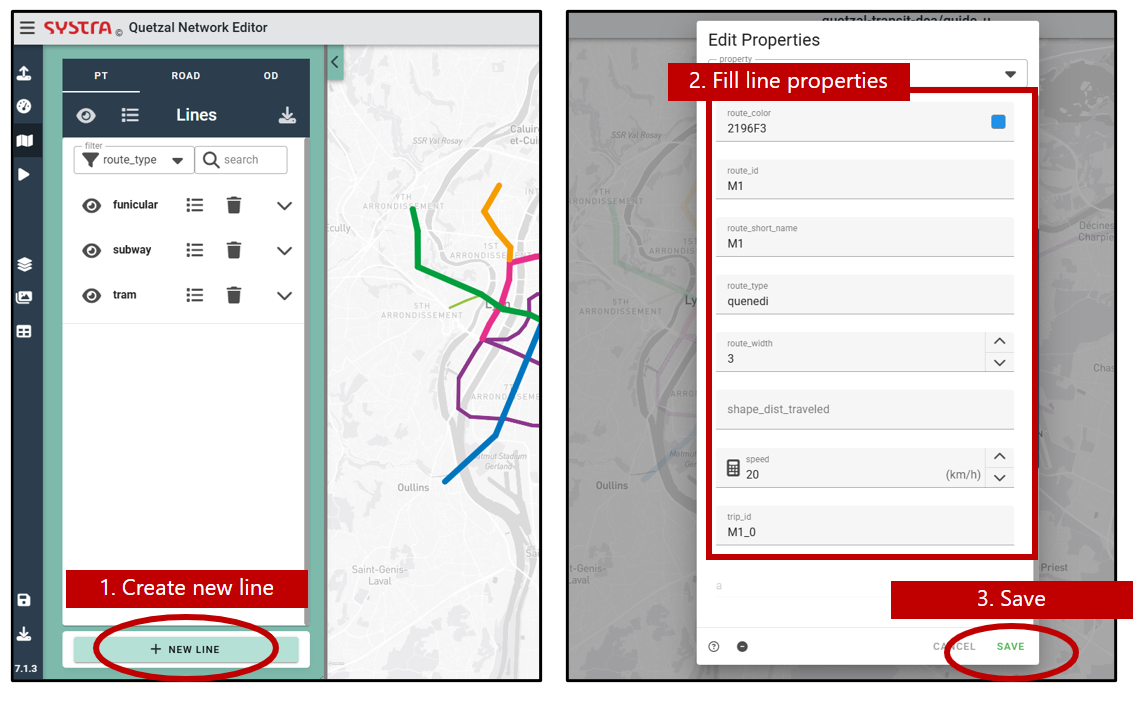
In order to add a new line, open the Map tab, click on the NEW LINE button. Then, fill in the properties of the new line. You may want to give it a name, a short name and a route type (such as bus or subway). Then, hit the SAVE button.
Mandatory line properties
For calculations to run successfully, you must ensure the following line properties are filled as follows:
"route_id": id of the route, unique for each route. This is the name of the line as it will appear in the results
"direction_id": 1 or 0. This attribute should match the suffix of the trip_id attribute. This attribute adjusts automatically when creating return lines (see below).
"trip_id": id of the trip, one trip_id corresponds to one line and one direction along this line. Needs to be formatted as route_id_direction_id (e.g.: "route_id"=A, "direction_id"=0, "trip_id"=A_0)
"headway": service interval in seconds.
"route_short_name": alias of the line, easy to read.
"route_type": type of transport: bus, train, tram...
"speed": commercial speed in km/h. This can be adjusted using road network speeds using. If a road network is used, public transport speed for lines using the road network will be adjusted.
Optional line properties
To enrich the analyses, you can add additional properties of the lines. To do so, scroll all the way down through the list of line properties, enter the name of your new field in the add field section, then hit the + symbol on the right.
The properties you can add are the following:
Catchment radius: for catchment to be computed, you also need to provide a zonage.geosjon file in the scenario's inputs (see section Scenario inputs above).
- catchment_radius: distance to the network used to compute network/line/station coverage (in meters). You may introduce several catchment radii to assess coverage for different access modes (people reaching the transport network by walking, biking, driving...). To do so, create different properties and name them catchment_radius_mode1, catchment_radius_mode2... , where mode1, mode2 should be replaced by the modes you wish to model (walk, bike, car...). Default value catchment_radius = 500m will be used if no value is set.
Service hours:
- nb_service_hours: Number of service hours. Default value nb_service_hours = 12 will be used if no value is set.
Peak hours parameters: if those fields are not added, no peak hour will be considered.
- nb_peak_hours: Number of peak hours throughout a day.
- headway_ph: Interval of service during peak hour (in seconds)
- headway_oph: Interval of service outside peak hour (in seconds)
💡 TIP
Alternatively, after creating your line, you will be able to define its time schedule. See section Create line time schedule below.
Capacity:
- capacity: Rolling stock capacity for the selected line. Default value capacity = 60 will be used if no value is set.
Operational costs:
- opex: Operational costs in €/veh.km. Default value opex = 0.3 will be used if no value is set.
Travel time: applicable only if a road network is used.
- road_pt_factor: Used only if links follow road network for this line. Speed reduction factor for road public transport modes (bus, express bus, etc.). Default value road_pt_factor = 1.25 will be used if no value is set.
- stop_interval: Dwell time, time penalty (in seconds) that is added to the total travel time for each stop along the line. Default value stop_interval = 300 will be used if no value is set.
Modal share: applicable only if a origin-destination matrix is used.
Draw a line
Once your line is initialized, click anywhere on the the map to start drawing. Stop drawing with a right click anywhere on the map. Once the line is complete, hit the CONFIRM button to save it, you can always edit the properties and the itinerary of your line later.
You can add a stop in the middle of a line with a left click on a link. You can also cut the line with a right click on a node > CUT BEFORE NODE or CUT AFTER NODE.
Create the reverse line
Once you have created a line for one direction, you can duplicate it and reverse it to create the return line. TO do so, click the duplcate icon in the list of lines and select reverse. Update the New name field to the desired trip_id of the new trip by matching the direction_id. If the trip you duplicated has its trip_id set to A_0, the trip_id of the return trip should be set to A_1.
For bus lines, you may have to adjust a litle bit the return line to avoid one way roads. To create bus stops on different sides of a road or create different routes for different directions, you must select the duplicate nodes option.
Import lines through the GTFS importer micro-service
You can also use the GTFS importer micro-service to import public transport networks from GTFS files, from your computer or directly from the online open mobilitydata database. See micro-service documentation here.
To ensure the calculations are successfully carried out, you must add the desired properties (among those mentioned in the Create a new line section above) to the imported lines. To do so, see the Edit line properties below.
Edit an existing line
Select a Line
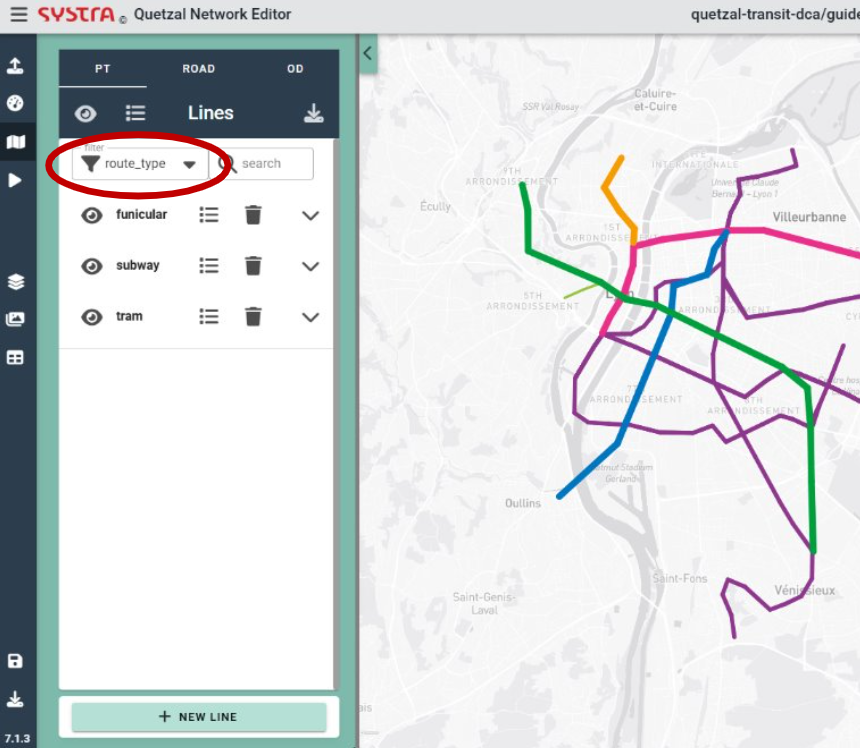
To edit the itinerary of a line, find it in the left pannel and click on its name (you can use the filters and the search function to find it). You can also use the search bar.
Alternatively, you can hover over the map and right-click on your line. If multiple lines are overlaid, a popup will open, allowing you to choose which line you want to edit.
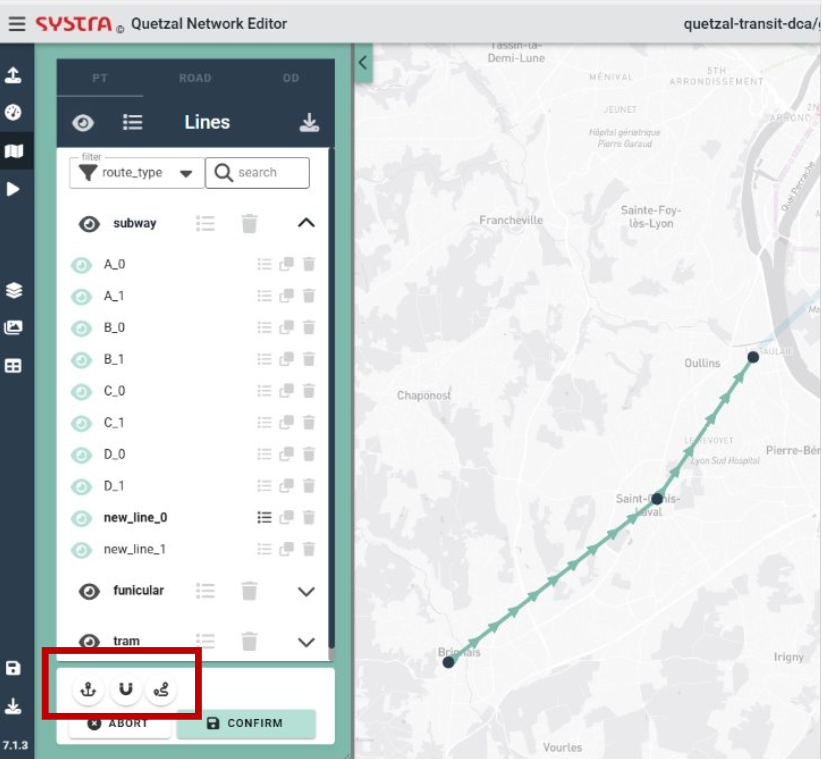
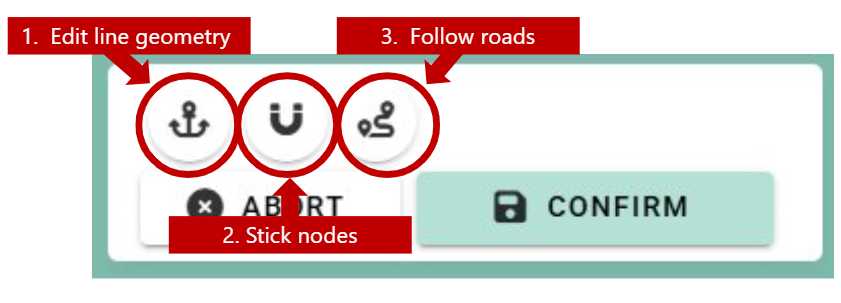
Editor Options
By default, when creating or editing a line, the geometry is created «as the crow flies», straight links connect the stations. The following options are also available:
- Edit Line Geometry
- Stick Nodes on Existing Nodes
- Follow Roads
Edit Line Geometry
With this option, you can place «anchors» on your line in order to define more precisely the geometry : left click on the line to add an anchor point, drag them wherever you want, right click to delete one. This points are not stops, passengers cannot board nor alight there.
Stick Nodes on Existing Nodes
With this option, the other public transport stops are displayed. When you edit your line, you can move a node over an existing node of another line to re-use that node for your line.
Follow Roads
With this option, the geometry of your line will follow the roads network (if provided; see documentation for more information on how to download road network) between all the new stops you add.
You can also click on ALL or NONE to map all your line to the road network or revert to straight lines (none).
For lines using this option, speed will be recomputed during calculations using road network speed. To refine road network speed, you can use the Matrix Road Caster micro-service. See the micro-service documentation for more information about how to use the
Edit Links and Nodes Properties
While editing a line, you can right click on a link to edit its propoerties. You can also do the same on a node to edit its properties, for example to give names to nodes.
Edit Line Properties
If you click on EDIT PROPERTIES in the side panel, you will edit the properties of all the links of your line (or selected group). It is relevant for the headway, catchment radii, rolling stock capacity for instance or if you want to set a constant speed on all the line.
Create or Edit a Schedule
By default, new lines are frequency-based, defined by the headway in the line properties. You can convert any line to be schedule-based by selecting CREATE SCHEDULE in the EDIT PROPERTIES form.
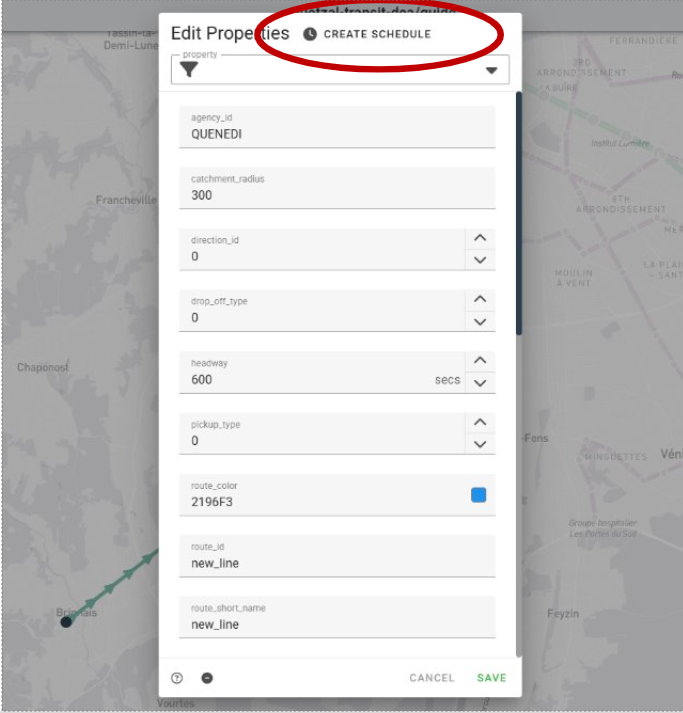
When creating a schedule, a single trip is generated with a starting time of 08:00:00, travel times based on links time, and a default dwell time of 0 seconds. In the departures section on the right-hand side, you can see the departure times from each station of the line for the trip. In the arrivals section, you can see the arrival times. From the schedule editor, you can:
- Edit the schedule times (Departures and Arrivals) at each stops
- Select the station label for the schedule graph
- Create a new trip
- Delete a trip
- Select a trip to edit
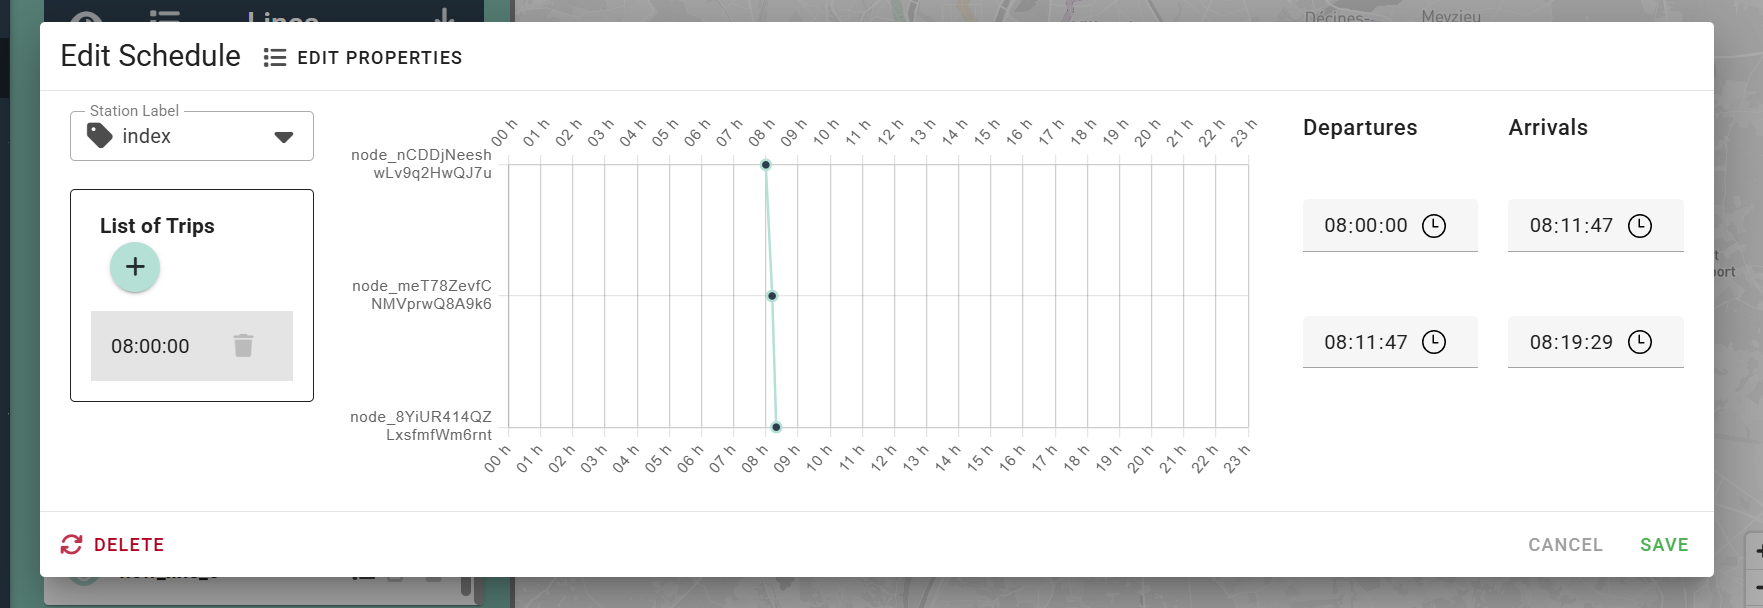
When creating a new trip, specify a start time. The travel times from the links and a default dwell time of 0 second will be used to compute the schedule.
Results
Once run, the simulation results in two types of outputs (for more guidance about model simulation, see documentation):
- Chart-type outputs, containing information about lines, trips, stops...
- GIS layers, allowing to visualize the results contained in the chart outputs on the map.
Chart outputs
To access the chart-type outputs of the simulation, go under the chart result tab. The available charts are the following:
- Hubs chart: Contains info about interconnections, including the list of stations connecting different lines and their names (a GIS layer is also available)
- Lines flows chart (available only if an OD matrix was provided): Contains total travel volume along each line of the network (GIS layers are also available)
- Lines catchment chart (available only if socio-economic data and catchment radii were provided): Contains information about catchment for each line, allowing coverage calculations.
- Lines characteristics chart: Contains the main line characteristics that could be calculated based on provided inputs (number of stations, round trip time, speed, trips per day, required fleet size, yearly vehicle.kilometers)
- Lines properties: Contains additional properties of lines, depending on provided inputs.
- Route type properties: Contains properties aggregated by route type (bus, subway, tram...)
Map outputs
To access the map-type outputs of the simulation, go inder the map result tab. Use the Layer drop-down menu to chose the layer you wish to plot. Available layers include:
- Hubs: To visualize stations and their coverage or the number of serving lines.
- Lines flow (available only if an OD matrix was provided in input): To visualize each line's volume.
- Lines catchment: (available only if a zoning file was provided): To visualize each line's catchment.
- Lines characteristics: To visualize all calculated characteristics of lines (such as round trip time, speed, veh.km, yearly operational costs...)
- Nodes: To visualize nodes and all their calculated properties (including node catchment if a zoning file was provided)
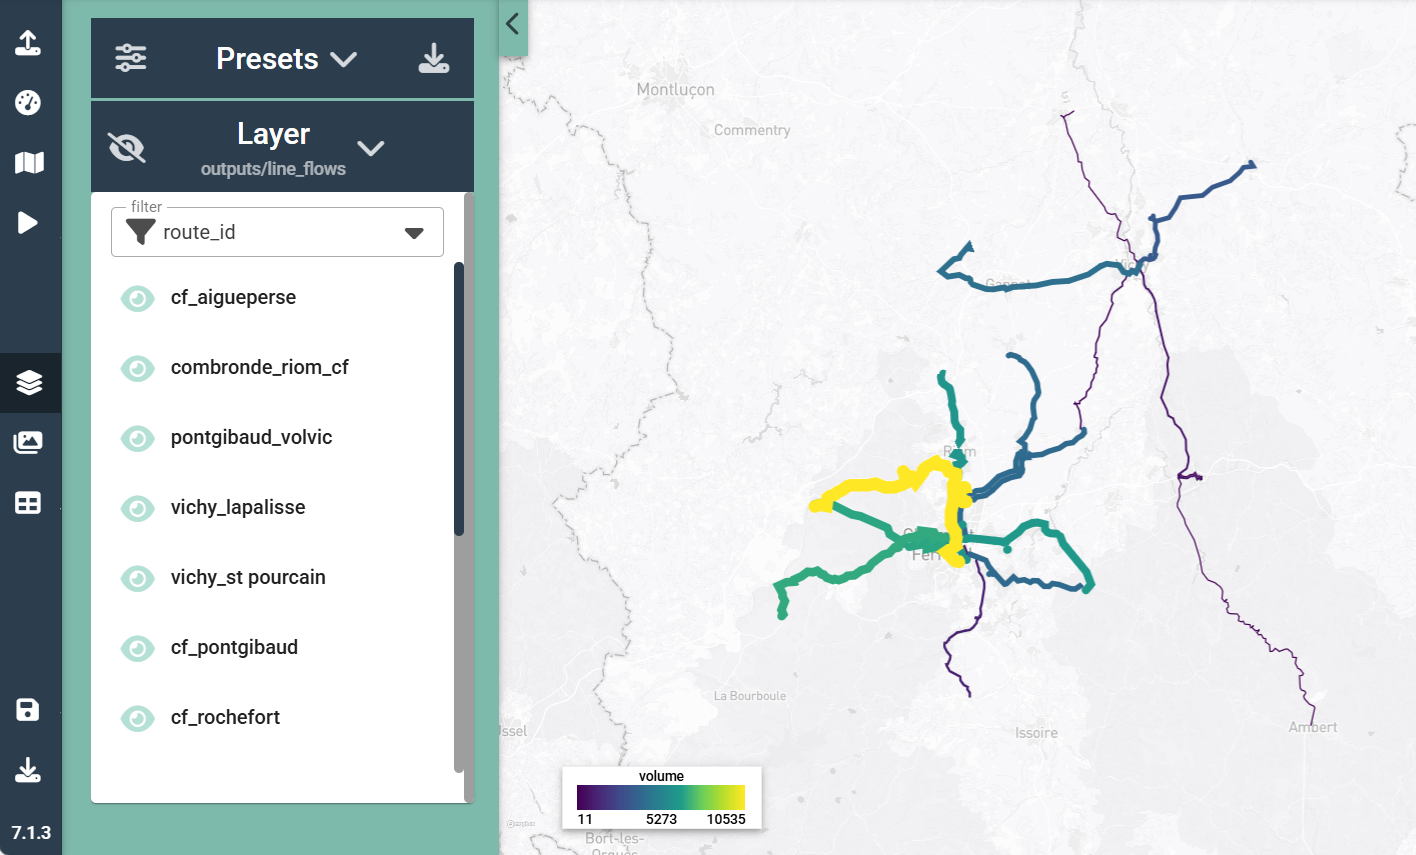
In the settings section (gear icon in the top-right-hand corner), you can chose the field of the layer you wish to plot using the selectedFeature drop-down menu and adjust the symobology.
Edit map styles and result layers
For more info on map styles edition and export, check out the documentation.